Filament has a concept of "Widget", which may be used in different contexts on different pages. But the most typical use case is the Dashboard: you can replace the default "Information" blocks with your own widgets.
This is what the default Dashboard looks like:
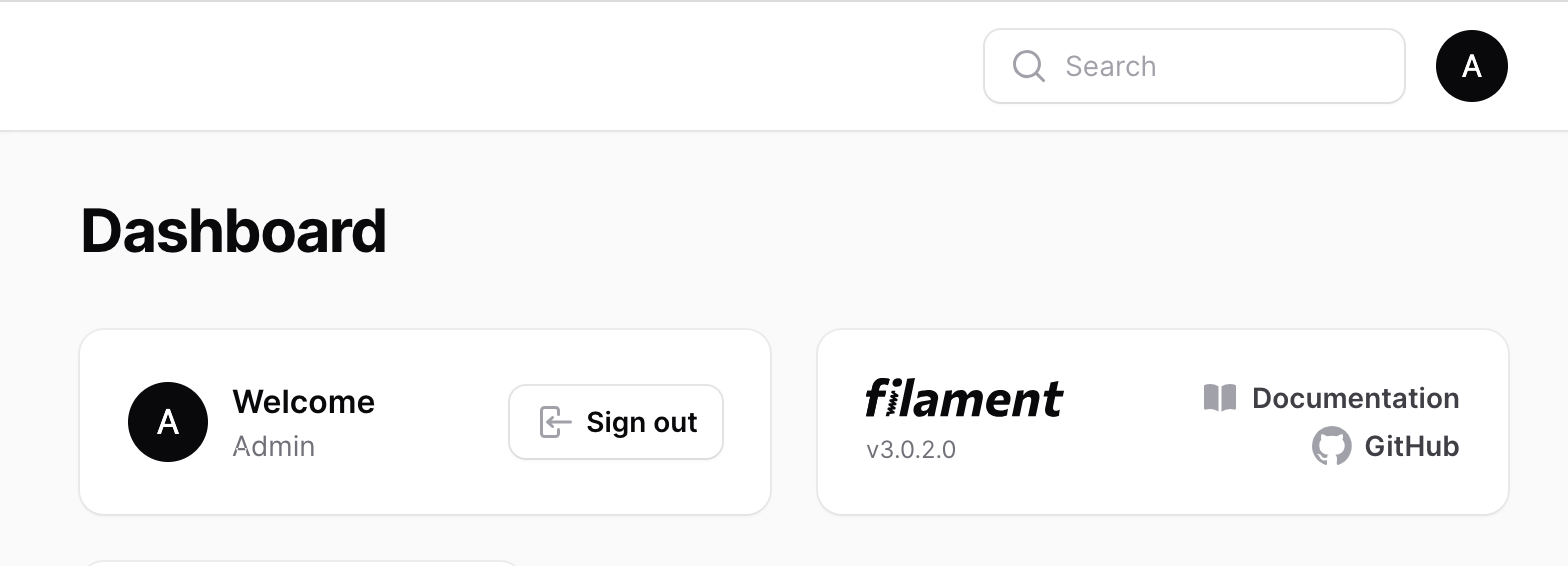
Not very useful, is it? A typical user shouldn't even know what version of Filament is running under the hood.
So let's add a few widget blocks here. Filament offers three typical widget types:
- Stats Overview
- Chart
- Table
I will show you all three, in this lesson.
Stats Overview: Total Revenue Widget
We will calculate the total revenue from orders in three slices: the sum of orders.price today, over the last 7 days and 30 days.
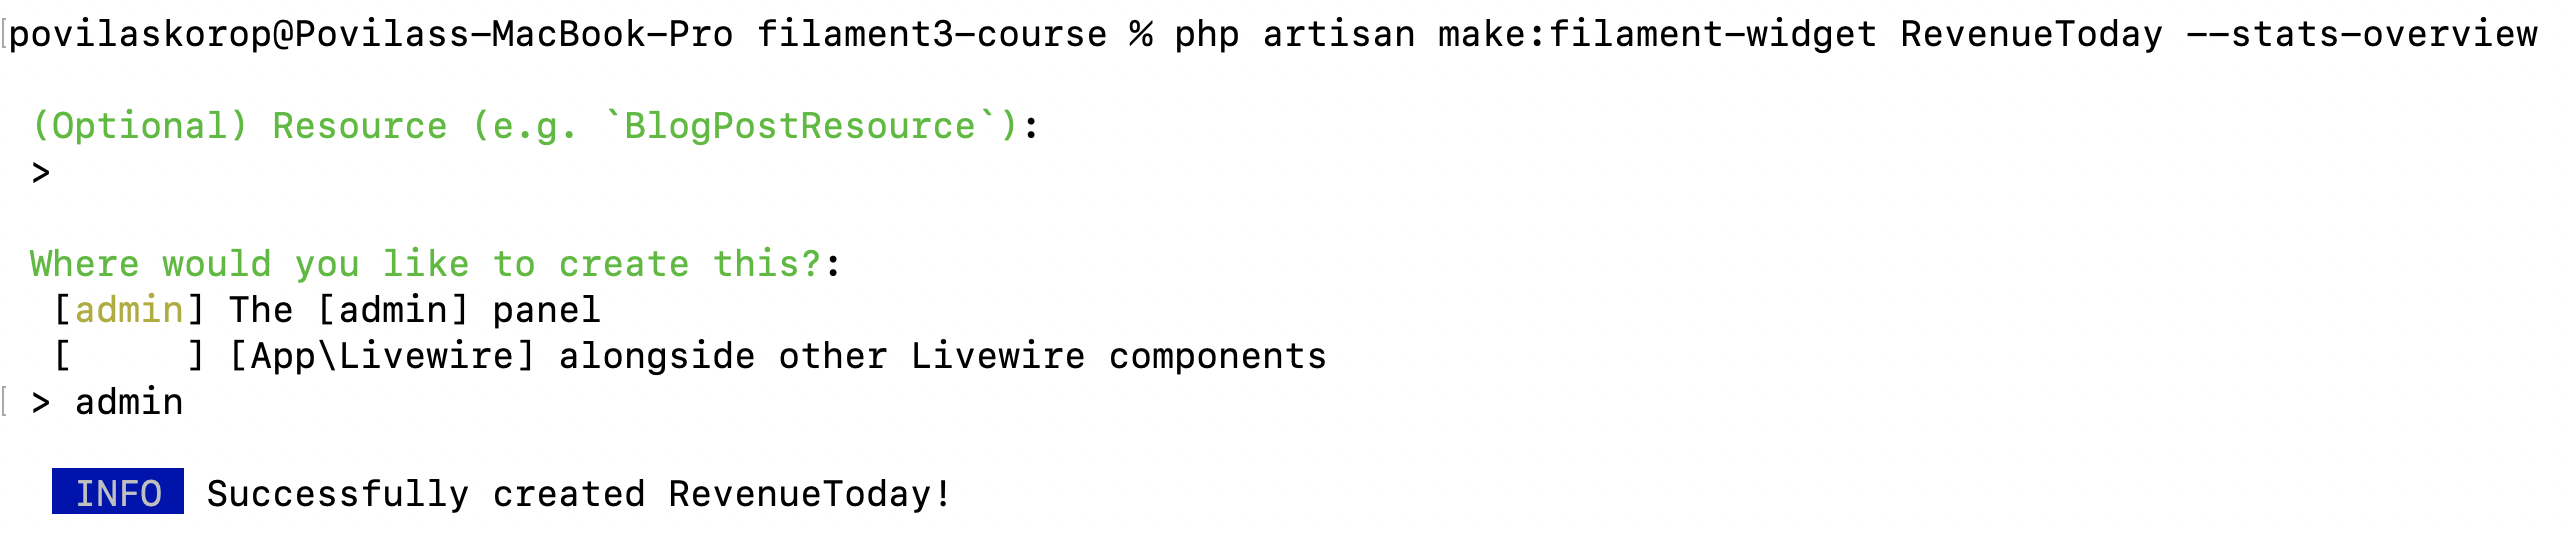
For that, we generate a Widget with the type stats-overview:
php artisan make:filament-widget RevenueToday --stats-overviewImportant: this Artisan command requires choosing the panel. Since widgets can be used outside of the dashboard as separate Livewire components, you need to choose specifically "admin" if you want to use it on the dashboard.
Then it generates the file in app/Filament/Widgets where we need to fill in the getStats() method. The syntax is this:
app/Filament/Widgets/RevenueToday.php:
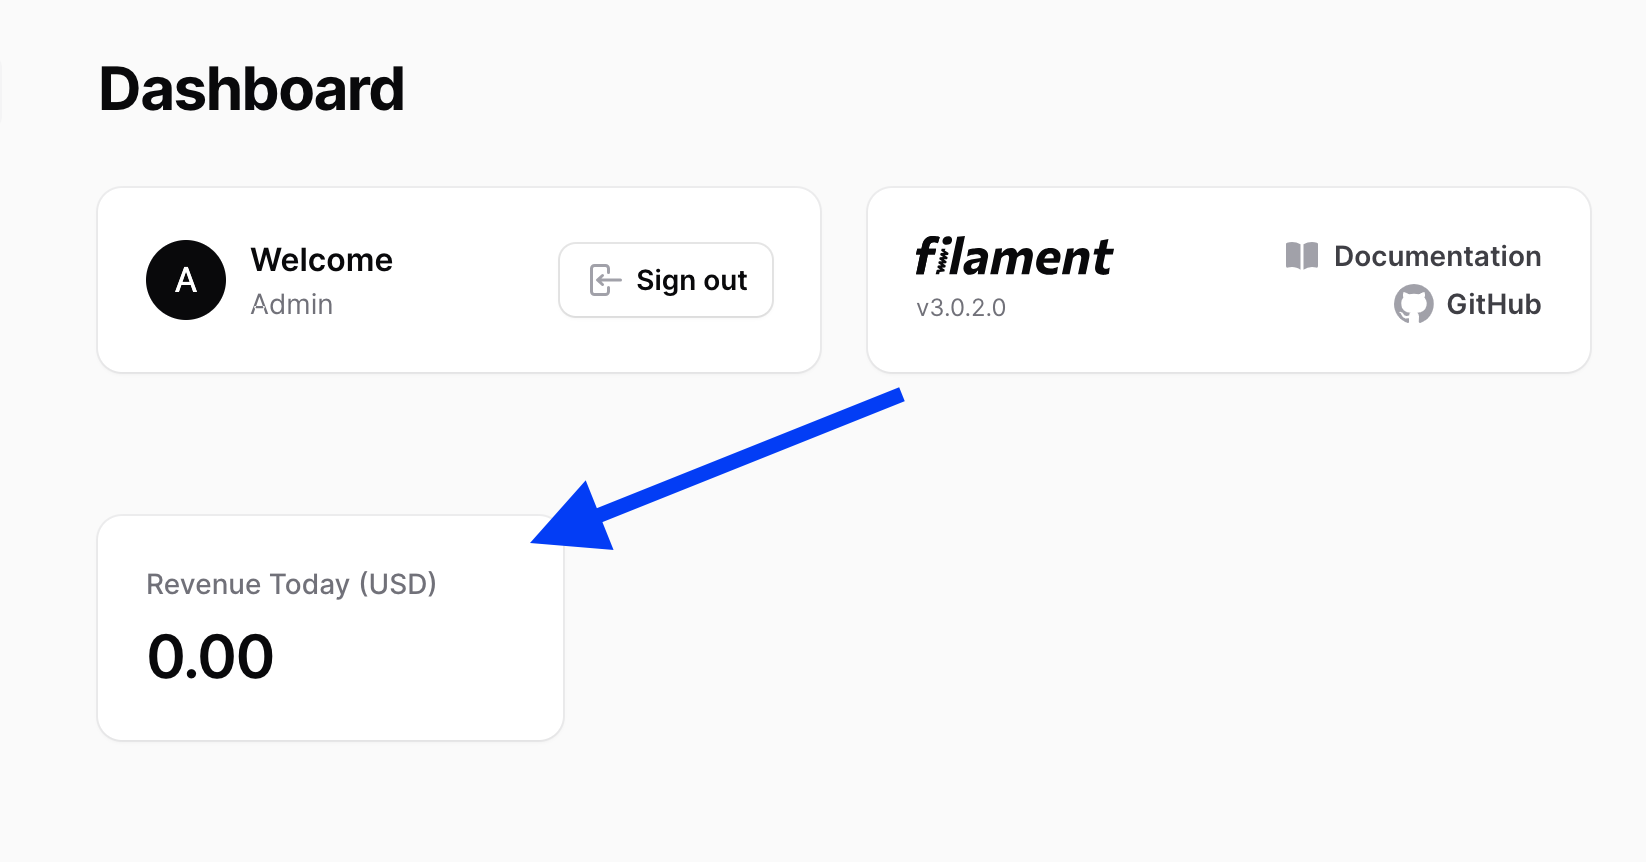
use App\Models\Order;use Filament\Widgets\StatsOverviewWidget\Stat; class RevenueToday extends BaseWidget{ protected function getStats(): array { $totalRevenue = Order::whereDate('created_at', date('Y-m-d'))->sum('price') / 100; return [ Stat::make('Revenue Today (USD)', number_format($totalRevenue, 2)) ]; }}As you can see, we have two parameters to Stat::make(): the title and the number/text we want to show.
And that's it. We have a new widget on the dashboard. No need to configure anything else!
But of course, this is just the beginning of our dashboard. Let's generate two more widgets with 7/30 day filters:
php artisan make:filament-widget Revenue7Days --stats-overviewphp artisan make:filament-widget Revenue30Days --stats-overviewapp/Filament/Widgets/Revenue7Days.php:
protected function getStats(): array{ return [ Stat::make('Revenue Last 7 Days (USD)', number_format(Order::where('created_at', '>=', now()->subDays(7)->startOfDay())->sum('price') / 100, 2)) ];}app/Filament/Widgets/Revenue30Days.php:
protected function getStats(): array{ return [ Stat::make('Revenue Last 30 Days (USD)', number_format(Order::where('created_at', '>=', now()->subDays(30)->startOfDay())->sum('price') / 100, 2)) ];}And this is the result!

Now, you would probably want to remove the default information widget blocks? Easy.
Go to the main PanelProvider and look at the widgets() method with the array:
app/Providers/Filament/AdminPanelProvider.php:
class AdminPanelProvider extends PanelProvider{ public function panel(Panel $panel): Panel { return $panel ->default() // ... ->pages([ Pages\Dashboard::class, ]) ->discoverWidgets(in: app_path('Filament/Widgets'), for: 'App\\Filament\\Widgets') ->widgets([ Widgets\AccountWidget::class, Widgets\FilamentInfoWidget::class, ]) // ... }}Just remove those two default array elements, and it will be only your individual widgets on the dashboard.

Want to sort the widgets differently? No problem, add the $sort property with the number.
app/Filament/Widgets/RevenueToday.php:
class RevenueToday extends BaseWidget{ protected static ?int $sort = 1;app/Filament/Widgets/Revenue7Days.php:
class Revenue7Days extends BaseWidget{ protected static ?int $sort = 2;app/Filament/Widgets/Revenue30Days.php:
class Revenue30Days extends BaseWidget{ protected static ?int $sort = 3;Now the widgets are shown in a different order:

Wait, you're probably saying they should be horizontally on one line? Glad you asked!
Have you noticed that every widget returns an array of Stat::make() sentences? So, we can group multiple stats in one widget and show them side by side.
So, let's refactor it all into one widget of TotalRevenueStats and have this inside:
app/Filament/Widgets/TotalRevenueStats.php:
use App\Models\Order;use Filament\Widgets\StatsOverviewWidget as BaseWidget;use Filament\Widgets\StatsOverviewWidget\Stat; class TotalRevenueStats extends BaseWidget{ protected function getStats(): array { return [ Stat::make('Revenue Today (USD)', number_format(Order::whereDate('created_at', date('Y-m-d'))->sum('price') / 100, 2)), Stat::make('Revenue Last 7 Days (USD)', number_format(Order::where('created_at', '>=', now()->subDays(7)->startOfDay())->sum('price') / 100, 2)), Stat::make('Revenue Last 30 Days (USD)', number_format(Order::where('created_at', '>=', now()->subDays(30)->startOfDay())->sum('price') / 100, 2)) ]; }}Looks good now!

The final important note about Stats Overview widgets is that they are refreshed automatically every 5 seconds. This is performed with Livewire wire:poll feature, and you can customize it or turn it off like this:
app/Filament/Widgets/TotalRevenueStats.php:
class TotalRevenueStats extends BaseWidget{ protected static ?string $pollingInterval = '60s'; // Or, put "null" to turn off polling: // protected static ?string $pollingInterval = null; // ...}Chart Widget: Revenue Per Day
The second type of widget is about charts. It has a vast amount of customizations for different kinds of charts: bar, line, pie, etc.
You can generate the widget with the Artisan command that will show you all the types as options:
php artisan make:filament-widget OrdersPerDayChart --chart
I've chosen the Bar Chart, and here's the default code generated by Filament.
namespace App\Filament\Widgets; use Filament\Widgets\ChartWidget; class OrdersPerDayChart extends ChartWidget{ protected static ?string $heading = 'Chart'; protected function getData(): array { return [ // ]; } protected function getType(): string { return 'bar'; }}Of course, the first thing we customize is the $heading:
protected static ?string $heading = 'Orders per day';Now, we need to fill the method getData() with the data of orders.price per day. We could built that data array manually, but Filament accepts a convenient syntax for "Trends" from an external package Flowframe/laravel-trend:
composer require flowframe/laravel-trendAnd then the complete code of the Widget class is this:
app/Filament/Widgets/OrdersPerDayChart.php:
namespace App\Filament\Widgets; use App\Models\Order;use Filament\Widgets\ChartWidget;use Flowframe\Trend\Trend;use Flowframe\Trend\TrendValue; class OrdersPerDayChart extends ChartWidget{ protected static ?string $heading = 'Orders per day'; protected function getData(): array { $data = Trend::model(Order::class) ->between( start: now()->subDays(60), end: now(), ) ->perDay() ->count(); return [ 'datasets' => [ [ 'label' => 'Orders per day', 'data' => $data->map(fn (TrendValue $value) => $value->aggregate), ], ], 'labels' => $data->map(fn (TrendValue $value) => $value->date), ]; } protected function getType(): string { return 'bar'; }}And here's the result:

Of course, you can customize the $sort, like in other widgets, but also you can specify the $columnSpan value from 1 to 12 or "full".
With that, we need to make it a bit smaller in terms of height, so we can specify that as well, with a property $maxHeight that accepts a string with the number of pixels.
class OrdersPerDayChart extends ChartWidget{ protected int | string | array $columnSpan = 'full'; protected static ?string $maxHeight = '300px';Here's how it looks now:

As I mentioned, there are many customizations for Chart widgets. See the docs. The dataset is based on the Chart.js library format, so you can check its documentation for more details.
Table Widget: Latest Orders
The last type of widget is a familiar one: it just shows the table, almost exactly like in the Resource table() method.
We generate it like this:
php artisan make:filament-widget LatestOrders --table
Then we need to fill in the columns array. I just copy-pasted it from the OrderResource file.
But also, we need to specify the query(), as the widget doesn't know that it's about the Order model. Here, we must provide just the Builder and not the full Eloquent query. In other words, everything before ->get():
namespace App\Filament\Widgets; use App\Models\Order;use Filament\Tables;use Filament\Tables\Table;use Filament\Widgets\TableWidget as BaseWidget; class LatestOrders extends BaseWidget{ protected int | string | array $columnSpan = 'full'; protected static ?int $sort = 4; public function table(Table $table): Table { return $table ->query( Order::latest()->limit(5) ) ->columns([ Tables\Columns\TextColumn::make('created_at'), Tables\Columns\TextColumn::make('product.name'), Tables\Columns\TextColumn::make('user.name'), Tables\Columns\TextColumn::make('price') ->money('usd') ->getStateUsing(function (Order $record): float { return $record->price / 100; }) ]); }}As you can see, I also provided the $columnSpan and $sort properties, and the final result of our dashboard looks like this:

In the official Filament docs, there's nothing more about Table Widgets, as all the customizations come from the tables in the Resources section of the docs. All syntax is the same.
Widgets in Filament Resources: Header/Footer
As I mentioned at the beginning of the lesson, widgets are not only meant for the dashboard.
In the previous Artisan commands in this lesson, have you noticed that you may optionally specify a Resource? Let's do exactly that:

So, we can create a Widget inside the app/Filament/Resources/ folder of the specific resource and then show that widget on the List page.
Let's copy-paste the code from the dashboard widget for total revenue today and 7/30 days.
app/Filament/Resources/OrderResource/Widgets/TotalOrders.php:
namespace App\Filament\Resources\OrderResource\Widgets; use App\Models\Order;use Filament\Widgets\StatsOverviewWidget as BaseWidget;use Filament\Widgets\StatsOverviewWidget\Stat; class TotalOrders extends BaseWidget{ protected function getStats(): array { return [ Stat::make('Revenue Today (USD)', number_format(Order::whereDate('created_at', date('Y-m-d'))->sum('price') / 100, 2)), Stat::make('Revenue Last 7 Days (USD)', number_format(Order::where('created_at', '>=', now()->subDays(7)->startOfDay())->sum('price') / 100, 2)), Stat::make('Revenue Last 30 Days (USD)', number_format(Order::where('created_at', '>=', now()->subDays(30)->startOfDay())->sum('price') / 100, 2)) ]; }}Then, we need to show that widget on the List page. We can provide the getHeaderWidgets() or getFooterWidgets() method. Both return an array.
app/Filament/Resources/OrderResource/Pages/ListOrders.php:
class ListOrders extends ListRecords{ // ... protected function getHeaderWidgets(): array { return [ OrderResource\Widgets\TotalOrders::class ]; }}And here's the result: our stats widget above the table!

How do you add a link to a table widget to view the item?
Found it in your tables guide, for others looking to do the same:
Tables\Columns\TextColumn::make('title')->url(fn (Application $application): string => ApplicationResource::getUrl('edit', 'record' => $application->id])),
I have 3 stats widgets. One for Income, another for expenses. Is there a way to calculate the difference between the to for a third widget called Net Income? Trying to learn how to do basic math within a widget. Thank you!
Load everything into variables before the
return [and simply do the math with variables there :)It looks like a basic operation to me, so I'm not sure what issue you are having. Maybe add some code where I could guide you to the final result
Thank you for your help. I'm still fairly new and learning just how much I still don't know :) This site is amazing and a very good tool for someone just starting out like myself.
We all had to start somewhere! But don't worry, the road ahead will be fun once you get over a few bumps :)
You helped me! I took what you said and applied it to an online example that wasn't working before. It works perfectly. Thank you again.
Can anyone suggest how to use trends and filter by say, company_id? This probably is easy to do, and I did a lot of searching, but couldnt find anything. This site is amazing and is helping learn Filament, but I'm learning that I have a long ways to go to getting good. Thank you.
This might help you: //post/filament-dashboard-widgets-date-filters
It's not for the company_id, but you can change the date filter to the company filter as the logic is the same.
I'm getting somewhere with this. I just solved the problem and wanted to share my solution. This allows Trends to query just about anything (including company_id for multi-tenancy applications).
$data = Trend::query( Accounting::query() ->where('company_id', $tenant->id) ) ->dateColumn('date') ->between( start: now()->startOfYear(), end: now()->endOfYear(), ) ->perMonth() ->sum('amount');
Has anyone ran into a situation where the trend data is not relyable? I have a table with many rows. If I use trend to get a count of records by month, for example, and show the number in a chart based on 12 months, the data will change each time I hit refresh. This is hapening on my local enviroment, as well as VPS (server is maxed with ram & cores). I've tried the tricks of slowing down the chart to give the system time to preform the query with no effect on the outcome. If I'm expecting a count of 88, I probably get the correct(88) 1 out of 20 times that I hit refresh. Any help would be greatly appreciated. I created a workaround but struggle to understand why my code works and Trend is having issues.
Thank you :)
It should be reliable as long as your query is reliably made.
In your case, I would check what kind of query it makes to the database and debug from there
This is really odd. I have two charts, one income, and the other expense. The income gets read first and it is always good(it is on the same page and next to the chart with the issue). The expense is the exact same query except for the table being read. If I do nothing but watch the chart, the bar jumps to values that are equal a partial query. I know that the auto-updating is a function of the chart, but it seems to only read part of the table and almost all times, it does not query 100% of the date. Even if I hault the auto-updating, or add a delay, the chart is almost always the wrong value. I can share a private link, this is must unusable. Most of my laravel journey has been learning what I dont know, this seems like it isn't caused by an error with my code. This is my query..
$tenant = Filament::getTenant();
Hmm, this seems to be okay, but... what is the type of your
amount? Is it float by any chance? :)I would honestly install
telescopehttps://laravel.com/docs/10.x/telescope - find the query and try to run it in the database client. This could give you an idea if the results are correct (and I suspect that there is something funky going on with that)I struggled to find information on how to add a link to the "Stat" It's not in the documentation either.